
by Scott Heise aka HomerJr
As fun as it is to debate Star Realms strategy, theory craft factions, and run countless simulations, sometimes there is no substitute for real-world empiricism. As much as I love playing the Star Realms app (and I do LOVE playing the app), one disappointment is I have is that there there is a gold mine of hundreds or thousands of games worth of data out there with no way to get at it: which cards do you buy, how many times have you played each card, opening hand distributions, opening buys, number of turns, number of cards scrapped, bases destroyed, faction preferences, etc. This kind of post-game summary data is just begging to be mined for correlations to win rate for both the individual player and the entire player community.
Unfortunately, currently the only way to get this kind of data is to keep track of it yourself using a spreadsheet or other tool, which can be quite laborious and difficult to keep error free over a large games . Nevertheless, my thirst for some kind of empirical data to sink my teeth into drove me to look for an opportunity to collect some meaningful real world data. Luckily, I was recently a proud participant of the Star Realms Pan-Galactic League s#1 and #2, founded by Remy aka Aweberman and generously run by Brendan aka Carnie. Given the league’s closed player pool, locked league format, and relatively large number of games, what better opportunity would I have to gather some data?
Background
The Pan-Galactic Leagues (PGL) #1 and #2 were invitation-only, and composed of 24 top Star Realms online players chosen from active participants in the prestigious BGG Star Realms League. The players were divided evenly into 4 divisions. The league schedule was modeled after Major League Baseball: 114 total games per player, with 10 games against each division opponent and 3 games against each non-division opponent, culminating in a 8-player playoff. All games were to be played with the Vanilla format (no expansion content).
My Approach
I kept records for both PGL #1 and #2. For PGL #1, my data set was rather limited: who was 1st/2nd player, my opening hand distribution (e.g., $2/4, $4/4, $5/3, etc), final scores, and game length (number of turns). There isn’t a whole lot of data analysis that can be done with such a small data set, but I did observe two interesting correlations: 1st player start advantage (roughly 55/45 in favor of 1st player) and average turn length (25.0 turns, 4.1 std dev).
For PGL #2, I wanted to go deeper, so I recorded the same data from PGL #1 as well as the opening hand distributions and opening buys and for both me AND my opponent. Needless to say, this significantly added to the size and complexity of my spreadsheet and I did make some errors recording the data, but I think it was worth it!
I was mainly interested in looking for correlations between starting hands, starting buys, and win rate. For example, did certain distributions of the 10-card starting deck across the 2 opening hands correlate to winning more games? Did certain cards correlate to winning more games when purchased with one of the 2 opening hands? I was especially interested looking for correlations like this since I had recorded my opponent’s buys as well as my own.
I admit that 114 games probably isn’t enough to be statistically relevant with a game that has as much inherent randomness as Star Realms. But I also think that it’s just enough games that any strong correlations may become apparent. Plus, this is about the most data that I have the appetite to keep track of manually for 100+ games. 🙂

Data Dump!
Here are the ways that I parsed the data:
- Player 1 vs Player 2 Win Ratio
- Game Length
- Opening Hand Distribution and Win%
- Opening Buys Distribution and Win%
- # of Opening Buys and Win%
- Unspent Trade and Win%
All of the data presented here was from PGL #2 (114 games, vanilla).
Get ready… here we go…
Player 1 vs Player 2 Win Ratio
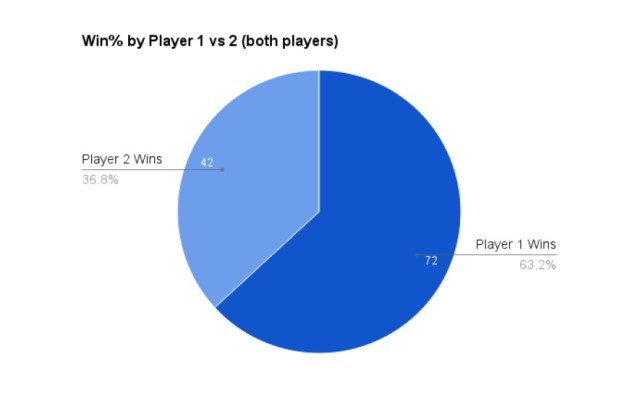
Wow…I was shocked to see that the player who went 1st had an ungodly win rate of 63.2%. This was unfortunate for me, as I was 1st player in 6 fewer games overall. This is quite different from PGL#1, where 1st player’s win% was only 53.2%. I do think there is an inherent advantage to going 1st in Star Realms, though I think it is exaggerated here. Not sure whether this is just a small sample set issue, or whether the players in this league really know how to press the advantage from going first. (For comparison, IceSphere’s Star Realms simulator puts the 1st player advantage at 58/42.)
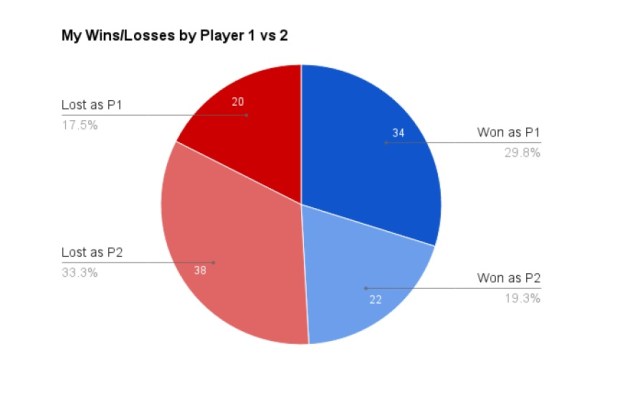
I finished the league with a nearly even record of 56-58 (.491), which is
nice from a data analysis standpoint because my performance doesn’t skew the data too much.
My Interpretation: 1st player advantage is real. Furthermore, the players in this league know what they’re doing, and I think this means a tendency towards aggressive play which further favors the 1st player.
Game Length
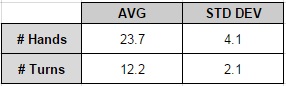
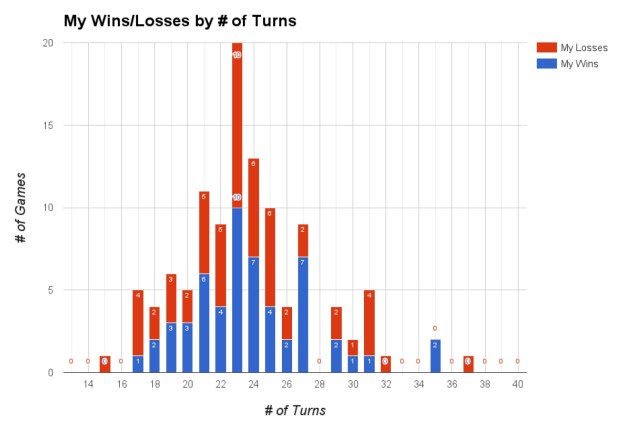
 The average number of turns was 23.7 with a standard deviation of 4.1. This is over a full turn faster than PGL #1 (25.0 avg, 4.1 std dev). As I pointed out in The Pace of the Game, Part 1, this is roughly equivalent to 4-5 decks (or 3-4 shuffles) per game, though I think the lower average in PGL #2 likely means a few more games ended in Deck 4 rather than Deck 5.
And what are the odds that no games ended on Turn 28? 😉
My Interpretation: I think the lower average number of turns in PGL #2 compared to PGL #1 is likely directly related to the 1st player’s high win%. I think that sneaking a precision kill in just before the 4th shuffle resulted in a several extra wins.
Opening Hand Distribution
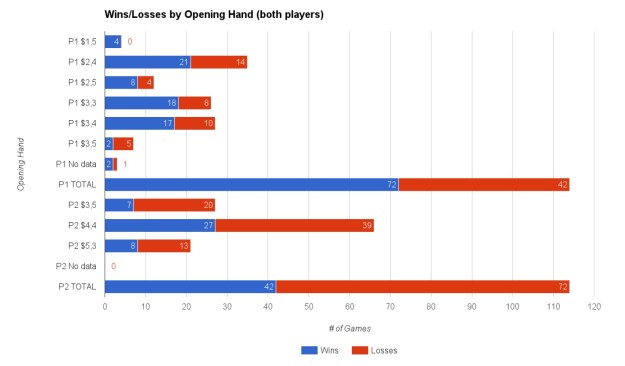
For Player 1 starting hands, $1/5 went undefeated and $3/3 also had a very high win rate. I had considered these two to be the most uncomfortable opening hands, but the data doesn’t lie. Interestingly, $3/3 also did well in PGL#1 (9-4, .692) so I guess the common anecdote that $3/3 is the worst 1st player starting hand could be an old wive’s tale. I also thought it interesting that $3/5 did poorly, as I would have thought that drawing all your trade and burying the vipers would be the best, if infrequent, way to start the game.
Player 2 performed poorly overall, but did best with the even $4/4 opening. Both “odd” openings did very poorly, with $5/3 doing slightly better than $3/5.
My Interpretation: As we’ll see in a second, many of the best performing opening buys are odd costed cards ($1 or $3), so I think this is a reason why the odd opening hands appear to do so well. Also, 1st player is innately more likely to have an odd amount of trade in his opening hand ($2/4 is the only even-even hand), and it means good things for the 1st player any time there’s a strong odd-costed card in the opening trade row.
Opening Buys Distribution and Win%
Here is where things get really interesting. For this data, I combined both my opening buys and my opponent’s opening buys into one big data set.
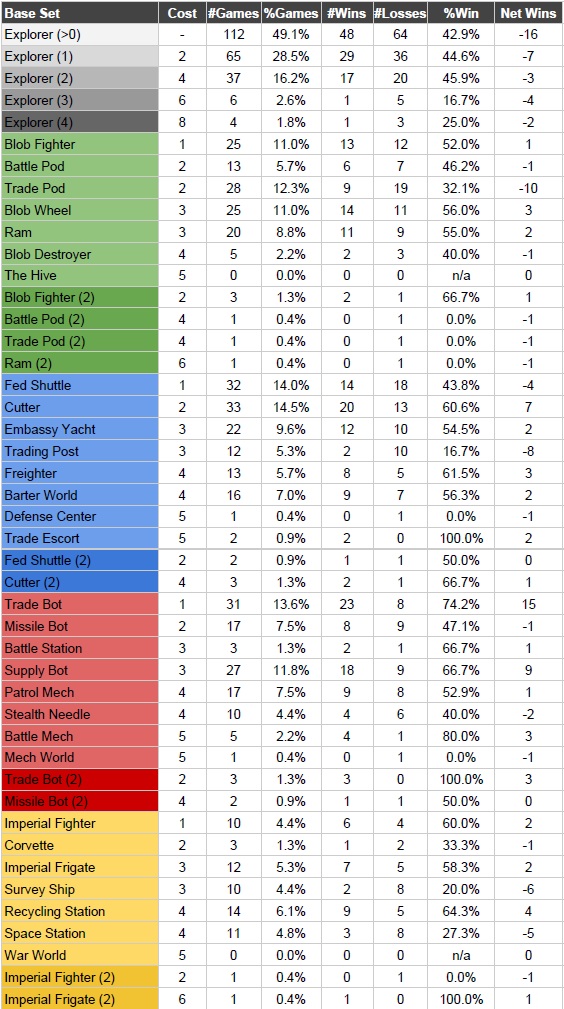
Whoa, that’s a lot of data! Let’s boil it down a bit:
Most Common Opening Buys:
- Explorer (49.1% of games)
- Cutter (15.8%)
- Fed Shuttle (14.9%)
- Trade Bot (14.9%)
- Trade Pod (13.1%)
- Blob Fighter (12.3%)
- Supply Bot (11.8%)
- Blob Wheel (11.0%)
- Embassy Yacht (9.6%)
- Ram (9.2%)
Least Common Opening Buys:
- War World (0 games)/The Hive (0 games)
- Mech World (1 game)/Defense Center (1 game)
- Trade Escort (2 games)
- Corvette (3 games)/Battle Station (3 games)
My Interpretation: Not really surprised here, as the most common opening buys were all cheap ($1/2/3) and have more copies in the supply deck, all of the least common are the most expensive ($5) and have only one copy in the supply deck (Corvette being the only exception… poor poor Corvette). Star Empire as a whole was uncommon as opening buys (the most common being Recycling Station, 6.1%), which is not that surprising given the relatively poor value of these cards at the start of the game. The high frequency of Blob Fighter surprised me, though I realize it’s value as a cheap combat card that helps destroy early bases and is a great way to spend an unused $1. It is worth noting that I played 12 games in PGL #2 prior to the patch that fixed the blue start bias, so Trade Fed cards are slightly over-represented here by one or two percentage points. (#CutterConspiracy)
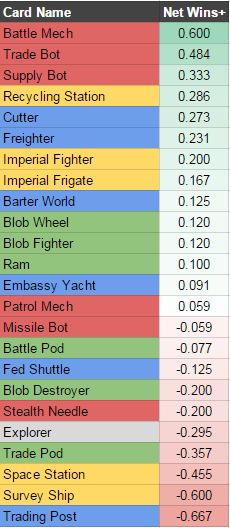
So which cards correlated most strongly to winning games? Direct win% is obviously skewed towards cards that weren’t bought frequently, so I think net wins is the best way to see which cards had the biggest impact on win%. The standard deviation of net wins was about +/- 4. I considered any card with more or fewer than 4 net wins to be either truly average in it’s performance “in the noise” due to a relatively small sample set.
Best Performing Opening Buys (greater than +1 std dev of net wins):
- Trade Bot (+18)
- Supply Bot (+9)
- Cutter (+8)
- Recycling Station (+4)
Worst Performing Opening Buys (greater than -1 std dev of net wins):
- Explorer (-16)
- Trade Pod (-11)
- Trading Post (-8)
- Survey Ship (-6)
- Space Station (-5)
- Fed Shuttle (-4)
My Interpretation: The top opening buys weren’t that surprising to me… it is no secret that scrap performs amazingly as opening buys. However, I was surprised at just how well Trade Bot did. I’ve hated on Trade Bot in the past, but it performed absolutely amazing by winning 75% of its games as an opening buy. (I’m definitely going to have to rethink my feelings on the Trade Bot.) Supply Bot and Battle Mech also had high win% (no surprise there), but what is surprising to me was how underwhelming Missile Bot performed, only breaking even on net wins. I suppose this shows how much adding a weak combat card offsets the advantage from scrapping your vipers early in the game.
What was surprising to me what who the worst opening buys were. Seeing Trading Post, Survey Ship, Fed Shuttle, and Explorer at the bottom of the list was no surprise, but TRADE POD?! Whoa! Seriously, who saw that coming?! And it did absolutely TERRIBLE!!! (31% win rate) I was very surprised by this. Any thoughts as to why Trade Pod did so poorly? Is “big trade” simply overrated?
I was also surprised by the weak performance of the Space Station, which I usually consider to be a solid opening buy. I think that it’s better as a mid-game card, as the $4 trash ability is really only good if there is already a $7/8 bomb waiting in the row, otherwise it’s a tricky card to get early game value out of. I was definitely not surprised to see Fed Shuttle (bleh), Survey Ship (meh), and Explorer at the bottom of this list. Trading Post has always been the worst base in my opinion, as it is basically a glorified Fed Shuttle that costs 3x as much (it’s sole purpose in life is boils down to trigger the ally abilities of other Trade Fed cards).
Seeing the Explorer perform so poorly makes me wonder, is buying an Explorer better than buying nothing? I guess the only way to find out is to go with a “No Explorer” strategy for PGL #3 and see how I do. 😉
UPDATE: After publishing this article, I got some feedback from current #1 lifetime player Benjotron on the Star Realms fan-created Facebook page that my method of comparing cards by Net Wins artificially skews things towards the cheaper cards because they are more copies in the trade deck and are purchased more frequently, thus their net wins are inflated. This is a great point, as it makes the cheapest good cards (like Trade Bot) look better, and the worst cheap cards (like Trade Pod and Explorer) look worse. As a result, I re-evaluated the cards by their “net win factor”: net wins divided by number of times the cards was bought. This should provide a fairer evaluation of which opening buy has a stronger correlation to wins and losses.
Here are the opening buys sorted by “net win factor”. I omitted any cards that were bought fewer than 5 times.
As you can see, the “good” opening buys are still good and the “bad” opening card are still bad, but the relative magnitudes have changed. Battle Mech is now at the top of the list. Trade Bot is still very good but no longer twice as good as Supply Bot. Recycling Station also moved up above Cutter. Explorers and Trade Pod are still in the bottom 5 but are not nearly as bad as they appeared before.
Thanks for the feedback, Benjotron! I think this is a better way of evaluating the relative strengths of each card as an opening buy.
Number of Opening Buys
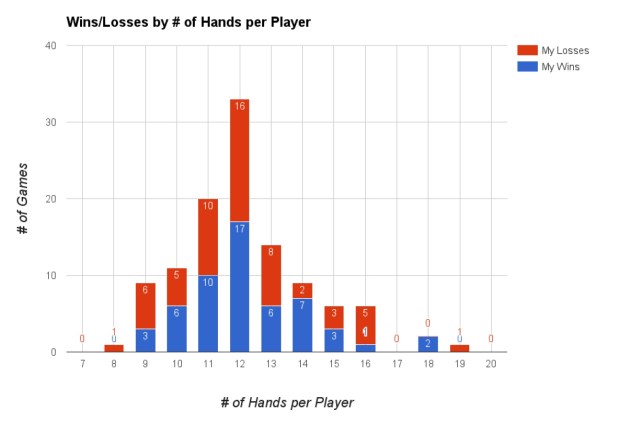
In my recent article Making Your Own Luck: Your Opening Buys and How Not to Bottom-Deck Them, I discussed how the number of cards you buy with your opening hands relates to the chances that they will be bottom-decked at the end of Deck 2, which can have a dramatic impact on the luck factor. So, was there any correlation between number of opening buys and win%?

So it turns out that I missed quite a few cards when tracking opening buys, which meant I had to disregard the entire game for the purposes of this data. D’oh! Still, I think there’s something to this…
Here’s the same data as above, but grouped by number of cards bottom-decked at the bottom of Deck 2 (read the article above you don’t know why I think this could be important):
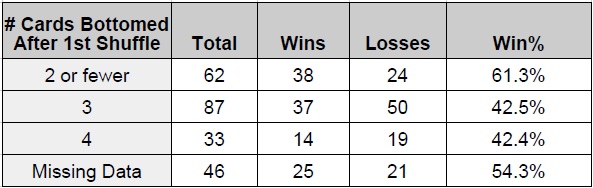
So, buying a number of cards that results in fewer cards bottom decked at the end of Deck 2 (2,5,6 opening buys) appears to result in higher win% than when more cards are bottom decked (3,4 opening buys). Given that the “Missing Data” appears close to average, I am feeling more confident that there is something to this.
Could this mean that playing with a higher luck/risk factor leads to a lower win% in the long run? Or is it that 1st player inherently buys fewer cards and there is a clear 1st player bias? Or is it that fewer more expensive cards simply have better value than more cheaper cards? Or is this just a bunch of nonsense?
What do you think?

Summary aka I Can’t Believe I Had to Scroll This Far for a TL;DR!
Phew! If you made it this far, I applaud you. 🙂
Here are my takeaways from this data:
- 1st player has an inherent advantage over 2nd player. Maybe not quite as substantial 63/37 as it was for me in PGL #2, but it appears to be around 60/40 based on my empirical data and IceSphere’s Star Realms Simulator.
- Average game length for PGL #2 was 23.7 turns, which was a full turn faster than PGL #1. I think this is because of the 1st player start bias appears to have been exaggerated in my games and skewed the average game length.
- “Odd” opening hands were better for 1st player (e.g., $3/3, $2/5), whereas “even” opening hands were better for 2nd player ($4/4). I think this has to do directly with Trade Bot and Supply Bot, as both rank as the best performing opening buys in the game and are odd costed-cards. Just a hunch.
- Trade Bot was the best performing opening buy by a long shot. Supply Bot, Cutter, and Recycling Station were the best performing opening buys overall (most net wins). I think this just shows how influential it can be to remove/recycle the Vipers from your deck at the start of the game.
- Explorer, Trade Pod, and Trading Post were the worst performing opening buys overall (most net losses). What’s up with Trade Pod? And no doubt that Explorer is bad, but is it worse than buying nothing?
- Buying fewer opening buys appears to correlate with a higher win%, but I can’t say why. More data is needed. MUST GO DEEPER.
Or is all this empiricism just a bunch of nonsense with a small sample-size problem? You be the judge!
Thanks for reading, and may the shuffles ever be in your favor.
Addendum – Same Data, More Charts


Excellent article! I can’t speak to most of your conclusions, but I would posit that there are very very few situations in which buying nothing instead of 1 or 2 explorers would be beneficial. I think instead the explorer discussion would need to focus on when you’re scrapping them. I routinely scrap explorers purchased D1 in D3, but I’m contemplating moving them up to D2 as a loose general rule given the data here. When do you usually find yourself scrapping them?
LikeLike
I agree, but that’s a discussion for a whole ‘nother article. 🙂 In general, I scrap them as soon as I can, typically in Deck 2. The only exception I have no other trade cards in my deck and the trade row is clogged with expensive cards. I rarely buy new explorers beyond Deck 2 as well.
LikeLike
I used to scrap Explorers really soon, however recent data I’ve seen in my simulator shows that it’s usually good to hold onto them a little bit longer, so D3 is probably the best time to scrap them in most games.
LikeLike
Now that is verrrrry interesting… very interesting indeed.
LikeLike
I wonder if looking at the number of opening buys might be misleading, since I would expect that it correlates somewhat with the strength of the cards you’re getting. Two opening buys might mean someone got, for example, two strong 4-cost cards instead of a bunch of lower-cost cards with a weaker average power level. The effect you’re seeing might not be due to bottomdecking then, but simply due to card quality.
LikeLike
I think this absolutely is the case. I think there is a correlation between number of opening buys and win%, but I can’t say what the root cause is. There are many possible reasons, including card quality, bottom-decking, 1st vs 2nd player bias, etc.
LikeLike
Awesome article!! The Trade Pod result is really surprising. I’m not very surprised by the Explorer result. I would say based on my own experience and data that I’ve seen from my simulator, buying an Explorer is definitely better than buying nothing, however I think the designers of Star Realms intentionally made Explorer a little bit weaker card, that way you would tend to buy cards in the trade row rather than just buy Explorers.
LikeLike
Totally agree with the Explorer design logic there. I think it really is just a consolation prize card.
LikeLike
“no doubt that Explorer is bad, but is it worse than buying nothing?
Is it really that bad in the opening? It depends on what you compare it with. It’s like double Scout and two-headed Viper in just one card! But there’s usually something better to take.
So Explorer’s statistical badness probably arises from it being taken when there’s nothing else affordable. In other words, it probably reflects a bad set of cards to select from, rather than a bad selection of the available cards.
LikeLike
Completely agree with you there.
LikeLike
Interesting data. Thanks for sharing. Your numbers on starting player advantage match my data quite well. I have been recording results for my online games for a while (basic game only), and get a starting player advantage of 59%. That’s currently based on 360 games against players of varying strength. Interestingly, a starting hand of 3 scouts has a winning percentage of 64%, 2 scouts and a viper only 53%, and 1 scout and 2 vipers a surprisingly high 63%. The last number is only based on 19 games though, so is fairly noisy.
LikeLike
Thanks! Glad to see your data compares well with mine. I think the 60/40 advantage of 1st player is definitely real.
LikeLike
This is a brilliant article. We’ll thought out. Thanks :).
LikeLike
Pingback: Blobs Away! A Cost Comparison within the Blob Faction. | Star Realms Strategy!